Application Note 1 describes how to log DACS voltage data with a Bash shell script. This note describes how to use Gnuplot to plot voltage data collected for an example application. Gnuplot is a free, full-featured plotting program supported on many platforms, including Windows and Linux. Readers not familiar with Gnuplot are encouraged to browse the Gnuplot home page.
The example application monitors the voltage on a 3-Volt battery pack powering a small DC-DC converter (called "zapper" in the plot text). The converter is randomly turned on by a microprocessor and the inverter's high voltage output is used to charge a high voltage capacitor.
The high-voltage output drives an array of randomly-flashing neon lamps that are used in a toy. The on time of the inverter is random, as is the off time. Randomly modulating the inverter's duty cycle changes the flash rate of the lamps: the longer the inverter is on, the greater the voltage buildup on the storage capacitor and the faster the initial flash rate.
Monitoring the battery voltage over a period of a month or so allows the time intervals to be adjusted to maximize battery life. In actual operation, the battery is turned on only at night to extend battery life.
The files and plots in this note can be downloaded as a tar archive, dacs_plotfiles.tgz.
To extract the script from the tar archive, enter: tar -xvf ./dacs_plotfiles.tgz at a command prompt. Note that this command line assumes that the archive file is in the current directory, which is most likely the download directory you selected or your default download directory.
On Linux systems, you may have to change the permissions on the extracted files before using them (e.g., use: sudo chmod 755 ./dacs_v1.plt).
Page 2
Figure 1 shows an excerpt of the output file generated by the shell script given in Application Note 1. The actual data file is much larger, covering approximately a month of hourly readings. Note that the voltage data is collected using the default resolution setting of "low" (millivolt resolution).
  140530-16:00:01 2.951
  140530-17:00:01 2.942
  140530-18:00:01 2.938
  140530-19:00:01 2.939
  140530-20:00:01 2.925
  140530-21:00:01 2.930
  140530-22:00:01 2.923
  140530-23:00:01 2.922
  140531-00:00:01 2.919
  140531-01:00:01 2.914
Figure 1. Typical DACS Voltage Data
Page 3
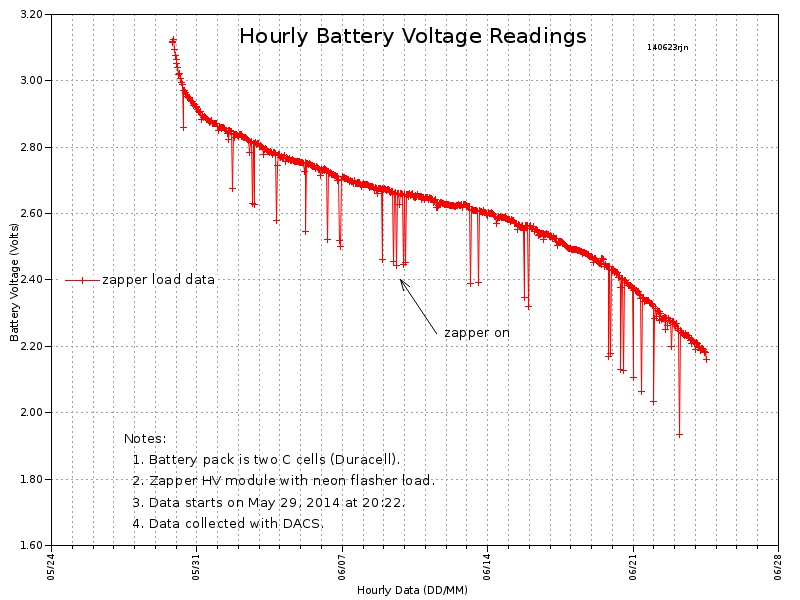
Figure 2 shows a plot of the voltage data. The periodic downward spikes in the data show battery voltage sags when the inverter happens to be turned on when an hourly data sample is taken. The spiking helps verify the on time cycling and its approximate frequency.
Figure 2. Plot of DACS Data
Page 4
Figure 3a and Figure 3b show the the Gnuplot source file used to produce Figure 2.
Most of the coding can be understood by using the Gnuplot help facility for each of the commands. The following sections comment on the Gnuplot commands. Note that text following a "#" is a comment.
Line 9 establishes the location and name of the plot output file, (dacs_v1.jpg). Line 11 establishes the output terminal type (jpeg) and resolution (640x480). Note that many other terminal types are supported, including a real time window that displays the results of the current plot.
Line 6 uses the "set title" command to define the plot title. Note that this command allows you to set the offset, color, font and size of the text. The "plot" command on line 58 references this title.
Line 13 establishes grid lines for major (x,y) and minor (mx,my) axes.
Line 15 sets a key label. It displays as a red line with a "+" plot symbol next to the label "zapper load data." This key identification is not necessary for the single plot shown here. But, is useful when multiple datasets are shown on the same plot and is shown in this example to illustrate key labeling.
If another a second plot would use a different color and plot symbol to show the effects of a different modulation regimen or turning the zapper off at night.
The "key" command allows the text to be placed on either side of the line designator. It also allows the key designators and text to be positioned at various locations on the plot so that they do not interfere with the plots. Line 14 shows how to place labels in a key box and move the box to another location.
Lines 17 to 31 place "Notes" text on the plot. The y axis spacing is parameterized so that it can be easily adjusted for all text lines.
Earlier, it was noted that the operation of the inverter produced negative voltage spikes. A text note with an arrow points to a group of these spikes. The code starting at line 34 shows how to specify and place the arrow and its associated text.
Line 39 positions a small date stamp to appear next to the title.
Page 5
  1   # dacs_v1.plt  -- 140622rjn
  2	#
  3	# Notes:
  4	# 1. Plot of zapper hourly data, day notation on x axis
  5	reset
  6	set title 'Hourly Battery Voltage Readings' offset 0,-3.5 tc rgb 'black' font "sans,16"
  7	# ----- directory/file -----
  8	cd '/home/bob/plots/dacs'
  9	set output '/home/bob/plots/dacs/dacs_v1.jpg'
 10	# ----- terminal type -----
 11	set terminal jpeg font "sans,8" size 640,480
 12	# ----- grid -----
 13	set grid x mx y my
 14	# set key box reverse center left
 15	set key reverse left center font "sans,10"
 16	# ----- notes -----
 17	basex = 0.1  # base x offset for notes
 18	basey = 0.2   # base y offset for notes
 19	spacey = 0.04  # y spacing for text lines
 20	#
 21	label_1 = 'zapper load data'
 22	#
 23	set label 'Notes:' at graph basex,basey  tc rgb 'black' font "sans,10"
 24	#
 25	set label '  1. Battery pack is two C cells (Duracell).' at graph basex,basey-1*spacey  tc rgb 'black' font "sans,10"
 26	#
 27	set label '  2. Zapper HV module with neon flasher load.' at graph basex,basey-2*spacey  tc rgb 'black' font "sans,10"
 28	#
 29	set label '  3. Data starts on May 29, 2014 at 20:22.' at graph basex,basey-3*spacey  tc rgb 'black' font "sans,10"
 30	#
 31	set label '  4. Data collected with DACS.' at graph basex,basey-4*spacey  tc rgb 'black' font "sans,10"
Figure 3a. Gnuplot Source for DACS Data Plot (Part 1)
Page 6
 32	#
 33	# ----- arrow pointing to load dip -----
 34	set style arrow 2 head filled
 35	varrow = 0.40  # arrow vertical pos.
 36	set arrow from graph 0.53,varrow to graph 0.48,varrow+0.1
 37	set label 'zapper on' at graph 0.54,varrow  tc rgb 'black' font "sans,10"
 38	# ----- date, initials -----
 39	set label '140623rjn' at graph  0.82, 0.94  tc rgb 'black' font "sans,6"
 40	# ----- x axis -----
 41	set xdata time
 42	set timefmt "%y%m%d-%H:%M:%S"
 43	set xrange ["140529-20:25":"140629-00:00"]
 44	# set format x "%H:%M"
 45	set format x "%m/%d"
 46	set autoscale x
 47	set xtics out nomirror rotate  offset 0,0.5  font "sans,7"
 48	set xlabel  'Hourly Data (DD/MM)' offset 0,-0.2 tc rgb 'grey0' font "sans,8"
 49	# ----- y axis -----
 50	set ylabel 'Battery Voltage (Volts)' offset 2.75,0 tc rgb 'grey0' font "sans,8"
 51	# set autoscale y
 52	set yrange [1.6:3.2]
 53	set format y '%.2f'
 54	set ytics out nomirror offset 1,0
 55	# ----- datapoint style -----
 56	set style data linespoints
 57	# ----- plot -----
 58	plot 'dacs_v1.txt' using 1:2 title label_1 lt 1
Figure 3b. Gnuplot Source for DACS Data Plot (Part 2)
Page 7
Lines 41 to 48 control the x axis plotting. This is the trickiest part of the example because it uses date and time specification and formatting.
Line 41 declares the x axis data as time-formatted. Line 42 specifies the time format. This specification follows the normal Linux shell format.
Line 43 specifies the range of xdata. With this, all data within the range is plotted. You can use the "index" command to skip over data (e.g., plotting every fourth data point within a range). Plotting all hourly data results in a thicker graph line.
Line 45 specifies the x axis labels to be in a "MM/DD" format. Line 46 allows Gnuplot to automatically set the scaling.
Line 47 controls the appearance of the axis "ticks" (in or out), the rotation of the x axis labels (rotate), offset from the plot axis line (0,0.5) and the font and font size (sans,7).
Line 48 sets the x axis label, its offset, color, font and font size. Line 50 sets the y axis label, its offset, color, font and font size.
Line 52 establishes a specific range for the y axis. For the zapper tests, the zapper stops operating at approximately 0.8 Volt. The lower range is set at 1.6 Volts to make the plot more presentable for the example.
Line 53 specifies the y axis format to display data to two decimal places. Line 54 controls the formatting of the y axis, as outlined above for the x axis.
Line 56 sets the style to use for the datapoint plotting. In this case, the style is datapoints connected by line segments.
Line 57 controls the plot itself. It specifies the source of the data, the file 'dacs_v1.txt', and which columns to use. In this case, columns 1 and 2 are specified (the only two columns in the data file).
Often, a data file contains multiple columns and several plot commands are used to plot data from different columns on the same plot (hence the need for "key" labels). The plot command also specifies the title and the text to use for the key label ("label_1" in this case). The "lt 1" specifies the color to use for the plot data.
Page 8
Corrected figure numbering and labeling. |
||
Misc. formatting and error corrections. |
||
Initial Release |
Copyright © June 22, 2014, Bob Nash.