The Events Per Unit Time (EPUT) instrument is a "lite" version of the EPUT device described in the November/December 2010 issue of QEX Magazine, published by the American Radio Relay League (ARRL).
The ELITE instrument uses the crystal clock of an AGEN Module to provide a "per unit time" timebase. Although the timebase is not as precise as that used in the article, it is very stable. This is all that is required for accurate indication of the differences between consecutive measurements. The ELITE events are typically the beat frequency output of a mixer used to compare two signals. For example, a 10 megahertz oscillator can be compared to a rubidium reference oscillator by observing the difference frequency. Changes in the difference frequency resulting from adjustments, for example, can be used to match a test oscillator to a reference oscillator.
The ELITE instrument displays its results using a serial data link. The link also allows a user to specify various measurement intervals ranging from one second to 100,000 seconds.
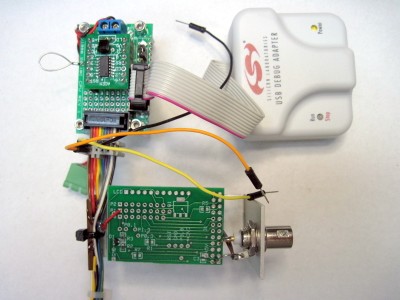
As shown in the cover photo above, the ELITE system consists of a socketed AGEN module mounted on a System Board and a separate input conditioning board (Input Board) mounted on a bracket. A BNC jack on the bracket connects to the mixer output. The system board includes and I/O connector and a connector for the Silicon Laboratories Debug Adaptor (for programming). Although ELITE is not a BOBZ product, it illustrates a practical use for an AGEN Module. An ELITE programming image can be downloaded to the AGEN module to duplicate this project.
For off-line reference, you can download a PDF version of this manual.
Page ii
(BLANK)
Page 1
Page 2
The Events Per Unit Time (EPUT) instrument is a "lite" version of the EPUT device described in the November/December 2010 issue of QEX Magazine, published by the American Radio Relay League (ARRL).
The instrument uses the 24.5 MHz crystal clock of an AGEN Module to provide a "per unit time" timebase. This clock is divided down to provide a nominal one-Hertz time base for measurements. Multiples of this timebase can be used for measurements requiring more precision. A serial terminal allows specification of timebases ranging from one to 100,000 seconds (more than a day). The serial terminal also provides the EPUT readout.
The one-second timebase used in the article was derived from a logic divider chain driven by a rubidium reference oscillator. However, extreme accuracy is not required of the timebase, only stability. To compare two readings over the same interval, it is only necessary to ensure that the time interval does not change significantly between the two measurements. This is assured using a timebase derived from a crystal oscillator.
For convenient reference and improved readability, we recommend that you download high resolution ELITE schematics.
As shown in Schematic 1, the ELITE input is conditioned by a clipping and attenuation network before being fed to an AGEN input pin. This signal conditioning is shown within the component grouping labeled "COMPONENTS ON EPUT BOARD", indicating that they are physically mounted on a separate board originally used for the EPUT project in QEX. The board is mostly unused and serves only to mount the conditioning components.
The EPUT Board and its few components is shown in the cover photo, at the bottom center. It is mounted on a small aluminum bracket that serves to mount the input BNC connector, the EPUT board and ribbon cable connections from the protoboard. Only a few of the I/O connections are used: the remainder are folded back and tie-wrapped to the back of the bracket.
Signal clipping is performed by the back-to-back diode array, D2 and limiting resistor R3. After clipping, the signal is attenuated to reduce the amplitude so that the comparator voltage input range is not exceeded (approximately 250 millivolts). Capacitor C5 reduces high frequency noise in the input, attenuating frequencies above approximately one kilohertz.
Once conditioned, the input signal is fed to port 0, pin 0 (P0.0) of the AGEN board. The signal is applied to the processor's internal comparator. The comparator input is single-ended: the other input to the comparator, P0.1, is grounded.
Page 3
Photo 1 shows the comparator output for a 400 millivolt input. Photo 2 shows the comparator output for a 10 Volt input. Note that the signal inputs were taken at the input to the chip. Also note that the signals are at different frequencies. The noise at the tops of the inputs is likely due to mixer products.
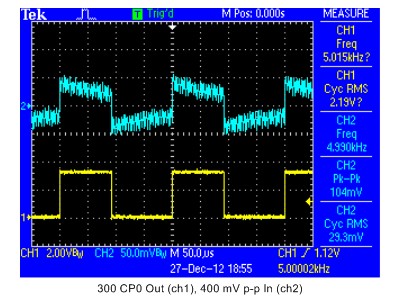
Photo 1 -- Comparator Output for a 400 millivolt Input
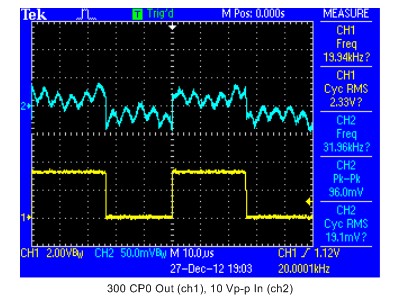
Photo 2 -- Comparator Output for a 10 Volt Input
Page 4
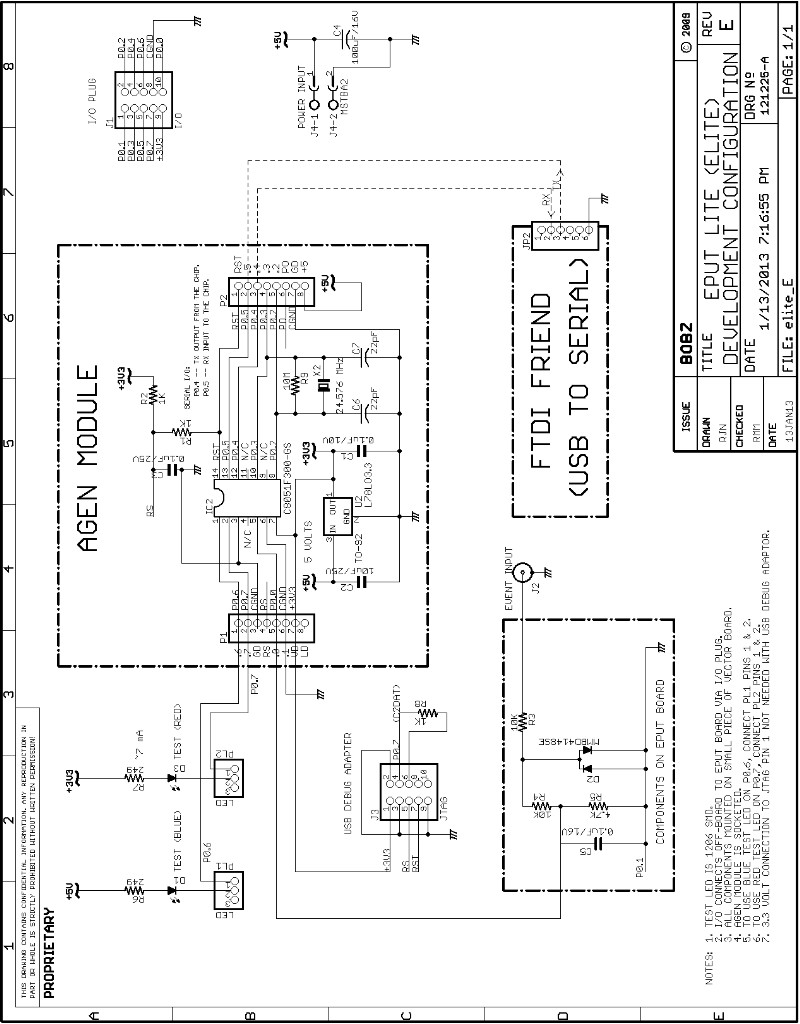
Schematic 1 -- ELITE Development System
Page 5
The project was originally designed for Robert Miller, KE6F, for some audio and radio frequency mixers that he built. Schematic 2 shows the audio mixer schematic and Photo 3 shows the finished mixer.
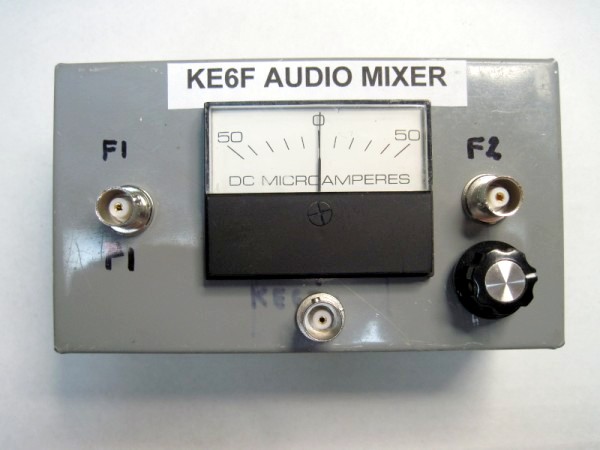
Photo 3 - Robert Miller's Audio Mixer
When the two input frequencies are close to each other, the beat frequency drives the meter at a visible rate. However, for very closely matched frequencies, the meter transitions may be very slow and may require a stopwatch and close visual monitoring. More precision measurements are possible by connecting the ELITE input across the meter and adjusting the sensitivity to provide a several hundred millivolt signal level.
The ELITE options were designed to provide indications of both high rates and very slow rates. For very closely matched signals, significant counts may be accumulated only over very long intervals. The default interval is 100 seconds, a compromise between waiting for results and good accuracy at very slow rates.
One of the design objectives was to provide for easy tracking of intermediate results. This is accomplished by displaying the current count and interval as part of the user prompt. This is shown in the Operation section in the startup display (i.e., "0/100>" ). The current results appear every time the user hits the Enter or space keys: this results in a new prompt and results display.
When a measurement is complete, the prompt remains static, showing the last measurement performed. Thus, it is easy to compare measurements by scrolling through the terminal's display history.
Page 6
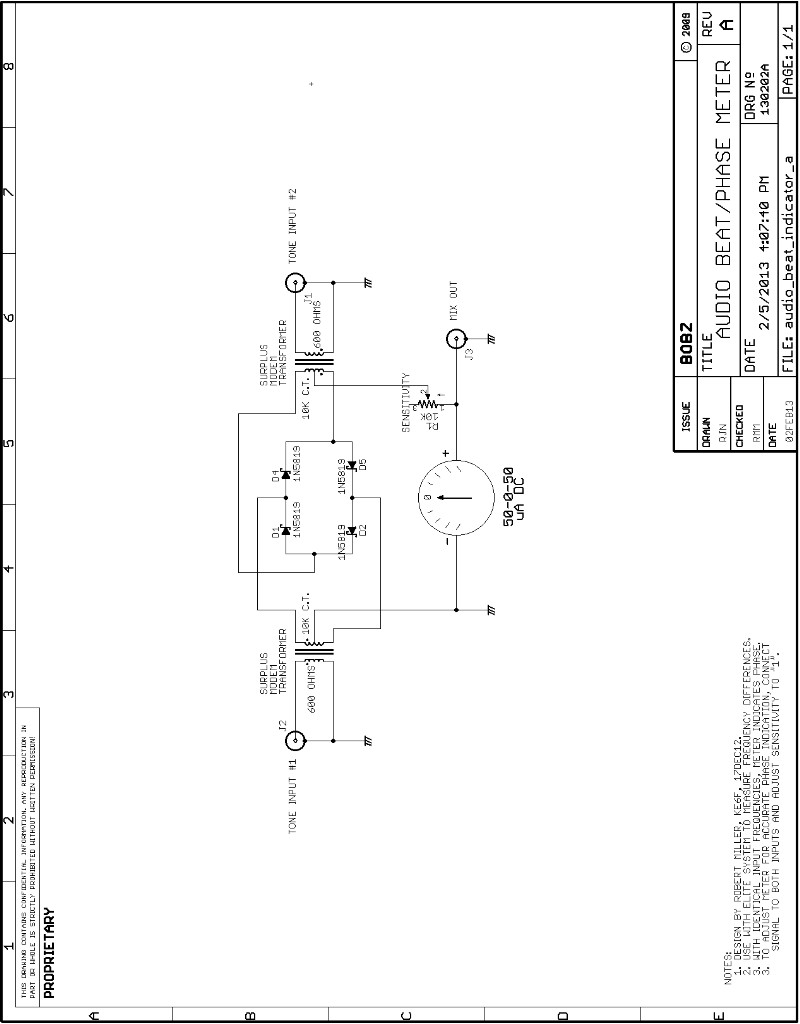
Schematic 2 -- Bob Miller's Audio Beat/Phase Indicator
Page 7
Startup --Once the module has been checked, you can download the ELITE project files and use the chip.hex file to program the AGEN Module with the Debug Adaptor. Also connect a serial terminal to the board. Settings are 9600 baud, 8N1 with local echo turned off. With the terminal connected, The help display, followed by a "!", is displayed at power up. The "!" signals that the help display was a result of a reboot. A manual reboot can be forced with the "r" command -- it also displays the help screen with a "!" ending.
Help -- Entering the "h" (help) command displays the screen below but it is followed not by a "!" but by the normal prompt. The normal prompt consists of the results of the last/current EPUT measurement, followed by a ">" character. Entering "h" soon after startup results in a prompt of "0:100>", indicating that no measurements have been performed with the default interval setting of 100 seconds.
 ELITE Version 130113 Commands:
 c   - Show configuration
 e,x - Show, clear error count
 h   - Show version, configuration and commands (help)
 i   - Show current count interval
        1s     - Set     1 second
        10s    - Set    10 seconds
        100s   - Set   100 seconds
        1ks    - Set    1k seconds
        10ks   - Set   10k seconds
        100ks  - Set  100k seconds
 n   - Start new counting interval
 q   - Query for current/last measurement
 r   - Force a reset
 v   - Show version (yymmdd)

 Notes:
    1. Commands execute on Enter or space.
    2. Prompts: > = normal, ? = command error, ! = reset/reboot
!
Configuration -- Entering the "c" command shows the current chip configuration. This is rarely of interest but does indicate that P0.7 is connected to the 1 Hz reference output and P0.6 is wired to the output of the comparator. This information may be useful when connecting monitoring LEDs to these pins for testing or monitoring. Thus, the configuration display showns that connecting the test LEDs to P1/1 and P1/2 allows visual monitoring of the operation of the ELITE instrument. The configuration command displays the following:
P0.0=CP0+ P0.1=CP0- P0.2,3=XTAL P0.4,5=TX,RX P0.6=CP0 out P0.7= 1 Hz
Page 8
Command Errors --A command error is indicated "?" after an attempt to execute the command. The command interpreter tracks these command errors and accumulates a total, up to 255. The "e" command displays the error count. The "x" command zeroes the error count. These commands are seldom used but can be useful if measurements are being performed automatically under the control of an external processor.
Show/Set Command Interval --The "i" command shows the current count interval. To set the interval, use the "1s", "10s", "100s", "1ks", "10ks", and "100ks" commands. For example, to set an interval of 1000 seconds, enter "1ks" and to set an interval of 10 seconds, enter "10s."
New EPUT Measurements --The "n" command starts a new EPUT measurement. The "q" command shows the current measurement total. Before a new measurement is started, the "q" command shows the last measurement. After a new measurement is started, "q" shows the current total and interval. An easier way to track a measurement in progress is to press the Enter key or the space key. These both display the normal prompt which includes the current results.
Version --The "v" command shows the version of the current software in "yymmdd" format. For example, a version of 130113 represents a date of January 13th, 2013.
Page 9
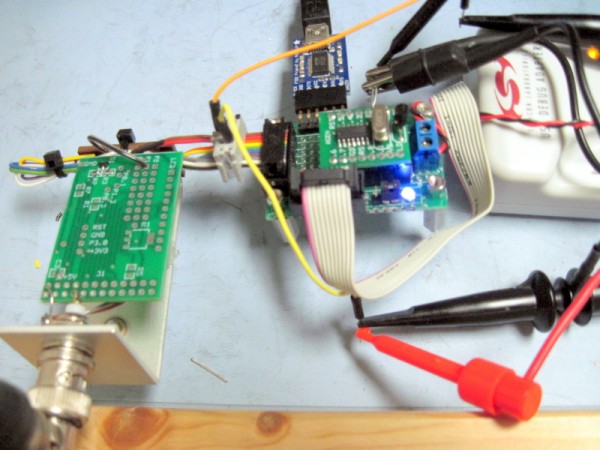
Photo 4 - ELITE Development Setup
Page 10
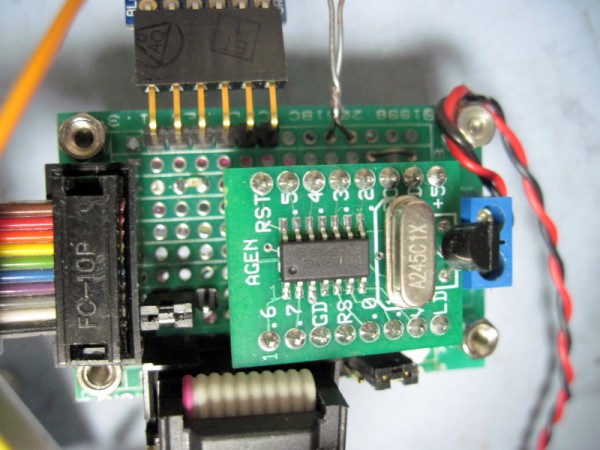
Photo 5 - Closeup of ELITE System Board
The ELITE System Board consists of a socketed AGEN module mounted on a small piece of perfboard with the following features:
The I/O connections to the input conditioning assembly are carried on the I/O ribbon cable shown at the left side of the photo and shown on the cover photo.
Page 11
Power -- At the far right of the photo is the 5 Volt power input cable (red and black wires) which connects to a two-terminal screw-down connector.
AGEN Module -- The AGEN module is plugged into a socket to to left of the power input. Not shown (under the AGEN module) is the input bypass capacitor.
I/O Connections -- On the far left of the board is the 10-pin shrouded IDC connector used to bring out I/O and power. This connector is shown with a socketed ribbon cable plugged in. The wiring follows our "standard" for 10-pin I/O connections.
Signal wiring follows the resistor color code. For example, port 0, pin 0 (P0.0) connects to the black (0) wire. Similarly, P0.2 connects to the red (2) wire and P0.6 connects to the blue (6) wire. The P0.4 (yellow) and P0.5 (green) connections are brought out on the connector but they also connect to the serial interface pins at the top left of the cloeseup photo.
The 3.3 Volt output of the AGEN module connects to pin 9 (white) and the common ground connects to pin 8 (gray). The I/O cable has two IDC sockets mounted on it, one on the end to plug into the system board and one near the board connector. The second socket provides access to cable wires. For example, solderless breadboard jumpers can be inserted into the socket for connection to an on-board test LED, an oscilloscope or a multimeter.
Serial -- The serial connection is implemented with a 1x6 right-angle stake pin connector that matches the pinout of the FTDI Friend serial adapter This is shown more clearly in the cover photo and Photo 4.
Indicators -- A red LED indicator, an 0805 SMT, is mounted at the top left of the board, just below the serial connections. It connects to the 3-terminal stake pin connector near the lower left of the board. As shown in Schematic 1, a BERG jumper can connect the LED to P0.7 or be left off to allow the center pin to be patched to ribbon cable I/O. Similarly, a second blue indicator LED, mounted near the bottom right of the board, connects to a 3-terminal stake pin connector that can be patched to P0.7. This connection is normally installed to monitor the operation of the comparator output for slow input signals. For faster signals, it lights dimly to indicate input activity.
Wiring -- Wiring to the board is performed with point-to-point connections with wire-wrap wire. In the future, we may make a PC Board for AGEN project prototyping. The wiring of the system board, input assembly and cabling is a weekend project: assembly time is approximately 5 to 7 hours. After board assembly we recommend that all connections be checked with a continuity tester before inserting the AGEN Module.
After checking the System Board and inserting an AGEN Module, the assembly can be checked by loading the adev_25x.hex program with the Silicon Labs IDE and Debug Adaptor. This program is described in the ADEV Project Description. The program can also be downloaded there.
Page 12
The first test can be performed by connecting a signal generator to the input and connecting the test LEDs to P0.6 and P0.7, as shown in Schematic 1. Apply a signal of approximately 20 Hertz with an amplitude of at least 100 millivolts Pk-Pk. The red test LED should blink at a rate of one Hertz (regardless of the input) and the blue LED should blink at the input frequency.
Enter a "n" command to start a new EPUT measurement. Press the Enter or space keys multiple times to monitor the progress of the EPUT measurement. The number at the far left of the prompt is the total number of counts received and the number to the right of the ":" character is the elapsed time in a 100 second interval. At the end of the measurement, the total counts should be approximately 2000 (20 counts/second times 100 seconds). The interval will be 100.
Once the unit operates correctly for a known counting input, its operation can be verified on the audio or RF mixers. To test with the audio mixer, for example, set up the following:
With this configuration, the meter on the mixer slowly swings back and forth at a rate of four seconds per cycle. The blue indicator LED should also flash at this rate.
Using the default 100 second interval and the "n" command, the measurement will likely yield a result like "38165:100", many times greater than the expected result. This is because the output of the mixer includes both sum and difference frequencies. The ELITE input does have some rolloff at a few thousand Hertz, but not enough to significantly reduce high-level inputs at 2 kHz. We measured the 2 kHz component at about 400 millivolts Pk-Pk.
For higher frequency audio inputs, this sum signal may not be a problem. To filter this component, we placed a one microfarad capacitor across the mixer output. This reduced the spurious output to less than 200 millivolts. Re-running the measurement yielded a result of "40:100", the expected result (four tenths of a Hertz difference from the 1 kHz reference).
Running the measurement again over an interval of 10,000 seconds (i.e., using the "10ks" and "n" commands), the result was 4018/10000 for a frequency error of 0.4018 Hertz. Note how this increased interval revealed that the waveform generator's frequency was slightly off (0.0018 Hertz).
Page 13
The following is a condensed version of our standard section on drawing 3.3 Volt power from the AGEN module.
![]() The module is not protected against input voltage reversal. Take care to verify that the correct voltage polarity is applied to the power input pins.
The module is not protected against input voltage reversal. Take care to verify that the correct voltage polarity is applied to the power input pins.
The AGEN board has a 3.3 Volt regulator to provide regulated power to the chip. The output of the regulator is also connected to an output pin to supply small amounts of 3.3 Volt power to other circuits (e.g., LED indicators). The power output appears on header P1, pin 7 (P1/7). Ground returns are available at pins P1/3 and P2/7.
If you are wiring a socket for AGEN, first test the connections with a continuity checker. Verify the correct output voltage soon after applying power to the module. The output voltage should be within a tenth of a Volt of 3.3 Volts.
The regulator is rated for a maximum input voltage of 16 Volts, a maximum current of 100 milliamperes and a dissipation of 250 milliwatts.
If applying more than 5 Volts to the regulator input, observe the device limitations, as illustrated by the calculations below.
Operating at 5 Volts, there is approximately 1.7 Volts across the regulator. Holding the regulator's dissipation to approximately half of the maximum is prudent. Thus, the maximum current drawn from the regulator should be approximately: (125 milliwatts)/(1.7 Volts) = 73.5 milliamperes.
When operating at 3.3 Volts without an external crystal, the module's quiescent current draw is approximately 10 milliamperes. Operating with a crystal module draw can be somewhat higher. Thus, the draw from loads external to the module should be limited to approximately 50 milliamperes.
Initial release for Charley Shattuck |
||
Cleanup for internet release |
||
Corrections |